
How to Make Your Website Faster: The Complete Guide for Founders
TL;DR - Key Takeaways
- Website speed directly impacts conversion rates: a 1-second delay reduces conversions by 7%
- 53% of mobile users abandon sites that take longer than 3 seconds to load
- Image optimization alone can reduce page load time by 50-70%
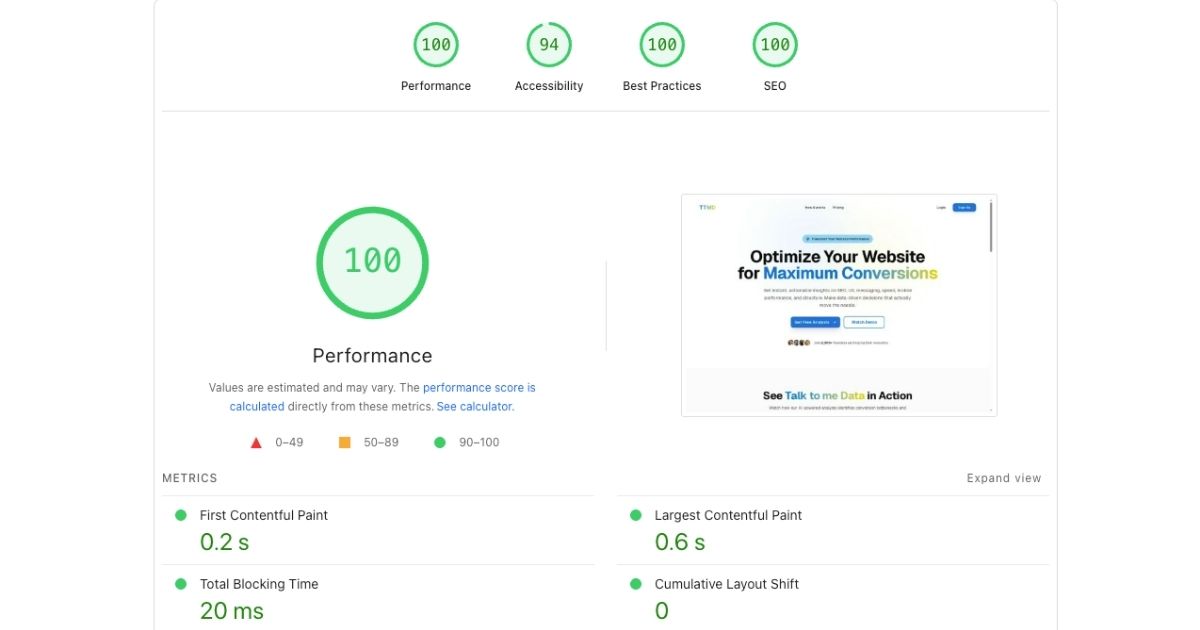
- Free tools like Google PageSpeed Insights, GTmetrix, and WebPageTest provide actionable optimization recommendations
- Most speed improvements require no coding: compression, caching, and CDN setup are configuration-based
- Core Web Vitals (LCP, FID, CLS) are now Google ranking factors. Optimizing them improves both speed and SEO
What is Website Speed and Why Does It Matter?
Website speed (also called page speed or site performance) refers to how quickly content loads and becomes interactive when a user visits your website. This encompasses multiple metrics: initial page load time, time to interactive (TTI), and perceived loading speed. Website speed is measured in seconds, with industry standards targeting under 3 seconds for complete page loads on desktop and under 5 seconds on mobile.
Page load time specifically measures the duration from the moment a user requests a page until all content (images, scripts, stylesheets) is fully downloaded and rendered in the browser. This differs from Time to First Byte (TTFB), which measures only server response time, and First Contentful Paint (FCP), which tracks when the first content becomes visible to users.
Why Is Website Speed Critical for Business Success?
Website speed isn't just a technical metric, it's a business imperative that directly impacts revenue, user experience, and search engine rankings. Google research demonstrates that as page load time increases from 1 to 3 seconds, bounce probability increases 32%. From 1 to 5 seconds, it increases 90%. From 1 to 10 seconds, bounce probability increases 123%.
The business impact is quantifiable and substantial:
- Revenue impact: Amazon found that every 100ms delay costs them 1% in sales. For a company with $500M annual revenue, that's $5M lost per 100ms of delay.
- Conversion impact: Walmart discovered that for every 1-second improvement in page load time, conversions increased by 2%.
- SEO impact: Google uses page speed as a ranking factor. Faster sites rank higher in search results, driving more organic traffic.
- User satisfaction: 79% of shoppers who experience poor site performance say they're less likely to purchase from that site again.
| Page Load Time | Bounce Rate Increase | Conversion Impact |
|---|---|---|
| 0-2 seconds | Baseline | Optimal |
| 3 seconds | +32% | -7% |
| 5 seconds | +90% | -20% |
| 10 seconds | +123% | -38% |
How Does Page Speed Affect Conversion Rates?
The correlation between page speed and conversion rates is direct, measurable, and significant. Studies across thousands of websites demonstrate consistent patterns: faster sites convert better, slower sites lose customers.
Here's why speed impacts conversions:
User Psychology and Speed Perception
- Instant gratification expectation: Modern users expect near-instant responses. Delays of even 1-2 seconds feel noticeably slow and create frustration.
- Trust and credibility: Slow-loading sites are perceived as unprofessional, outdated, or potentially unreliable. Users unconsciously associate speed with quality.
- Attention span limits: Every second of delay increases the likelihood users will abandon their task and leave for a competitor's site.
- Mobile user impatience: Mobile users are typically more task-focused and less tolerant of delays. 53% abandon mobile sites that take longer than 3 seconds to load.
The shortcut
PageSpeed gives you a score. An AI agent tells you which issue is costing you the most money.
Most founders run a PageSpeed Insights report, see 23 flagged issues, and have no idea where to start. The report tells you what is slow — it doesn't tell you which fix will move revenue.
An AI agent built for speed optimisation bridges that gap. It reads your performance data and translates technical scores into business decisions:
- Maps speed issues to conversion impact. Instead of "render-blocking resources detected," you get: "this issue is adding ~1.4s to your LCP and is estimated to cost you 9% in conversions."
- Prioritises fixes by ROI, not severity. Not every "critical" PageSpeed issue matters equally. The agent ranks your to-do list by expected revenue recovered per hour of work.
- Spots regressions before they compound. New plugin installed? Theme updated? The agent monitors your scores over time and flags drops before they become month-long conversion problems.
- Answers your "why is it still slow?" questions. After you've made changes, the agent validates whether the fix worked — and explains in plain language why the score moved (or didn't).
The sprint below is still valuable — but an AI agent means you're running it with perfect information, not working through a generic checklist hoping something moves the needle.
What Are Core Web Vitals and Why Do They Matter?
Core Web Vitals are a set of specific factors that Google considers important in a webpage's overall user experience. Introduced in 2021 as Google ranking factors, these metrics quantify real-world user experience across loading performance, interactivity, and visual stability.
The three Core Web Vitals metrics are:
1. Largest Contentful Paint (LCP)
Measures: Loading performance—specifically, how long it takes for the largest content element (image, video, or text block) to become visible.
Good score: 2.5 seconds or less
Needs improvement: 2.5-4 seconds
Poor score: Over 4 seconds
Why it matters: LCP represents when users can see and engage with meaningful content. Slow LCP means users stare at blank screens or loading indicators, increasing abandonment.
2. First Input Delay (FID)
Measures: Interactivity—the time from when a user first interacts with your page (clicks a button, taps a link) to when the browser responds to that interaction.
Good score: 100 milliseconds or less
Needs improvement: 100-300 milliseconds
Poor score: Over 300 milliseconds
Why it matters: High FID creates frustrating experiences where users click buttons but nothing happens. This is typically caused by JavaScript blocking the main thread.
3. Cumulative Layout Shift (CLS)
Measures: Visual stability—how much content unexpectedly moves around as the page loads.
Good score: 0.1 or less
Needs improvement: 0.1-0.25
Poor score: Over 0.25
Why it matters: Layout shifts cause users to accidentally click wrong buttons or lose their reading position. This is especially problematic on mobile devices.
How to Test Your Website Speed (Free Tools)
Before optimizing, you need baseline metrics. These free tools provide comprehensive speed analysis and specific recommendations:
| Tool | Best For | Key Features |
|---|---|---|
| Google PageSpeed Insights | Core Web Vitals, overall score | Real user data (CrUX), specific fix recommendations |
| GTmetrix | Detailed waterfall analysis | Historical tracking, video playback, multiple test locations |
| WebPageTest | Advanced diagnostics | Multiple device testing, connection throttling, filmstrip view |
| Pingdom | Monitoring & tracking | Global test locations, performance history, uptime monitoring |
Testing Best Practice:
Run each tool 3-5 times and average the results. Single tests can be affected by temporary server issues or network fluctuations. Test both your homepage and key conversion pages (product pages, checkout, signup forms).
How to Optimize Images for Faster Loading
Images typically account for 50-70% of total page weight, making image optimization the highest-impact speed improvement for most websites. Unoptimized images are the leading cause of slow page loads.
Image Optimization Strategy
1. Choose the Right Format
- WebP: Best overall format. 25-35% smaller than JPEG with same quality. Supported by 95%+ browsers.
- JPEG: Best for photographs. Use 80-85% quality setting for optimal size/quality balance.
- PNG: Use only for images requiring transparency. Convert to WebP when possible.
- SVG: Perfect for logos, icons, simple graphics. Infinitely scalable without quality loss.
2. Compress All Images
Compression reduces file size without visible quality loss. Uncompressed images from cameras or design tools are typically 10-20x larger than necessary for web use.
Free Compression Tools:
- TinyPNG/TinyJPG: Browser-based compression. Reduces images 60-80% with minimal quality loss. Free up to 20 images at once.
- Squoosh: Google's compression tool. Offers advanced controls for quality vs. size tradeoffs. Supports WebP conversion.
- ImageOptim (Mac): Desktop app for batch compression. Removes metadata and applies lossless compression.
- ShortPixel: WordPress plugin. Automatically compresses images on upload. Free tier: 100 images/month.
3. Use Responsive Images
Serve appropriately sized images based on device screen size. Don't load 3000px images on 375px mobile screens.
HTML srcset attribute enables responsive images:
<img src="image-800w.jpg" srcset="image-400w.jpg 400w, image-800w.jpg 800w, image-1200w.jpg 1200w" alt="Description" />4. Implement Lazy Loading
Lazy loading defers loading images until they're about to enter the viewport. This dramatically reduces initial page load time.
Native lazy loading (supported in modern browsers):
<img src="image.jpg" loading="lazy" alt="Description" />How to Minimize and Optimize JavaScript and CSS
Render-blocking JavaScript and CSS prevent pages from displaying until all scripts and stylesheets load and execute. Optimizing code delivery significantly improves perceived performance and Core Web Vitals scores.
JavaScript Optimization Techniques
- Minify JavaScript files: Minification removes whitespace, comments, and shortens variable names. This reduces file size by 30-50%.
- Tools: UglifyJS, Terser, webpack, Parcel (build tools handle this automatically)
- Defer non-critical JavaScript: Use
deferorasyncattributes to prevent scripts from blocking page rendering.defer: Downloads script in background, executes after HTML parsing completesasync: Downloads and executes script as soon as available (use for independent scripts like analytics)
- Remove unused JavaScript: Audit third-party scripts and remove those providing minimal value. Each script adds 50-500KB and 0.5-2 seconds to load time.
- Common culprits: old analytics trackers, unused social media widgets, abandoned A/B testing tools
- Code splitting: Break large JavaScript bundles into smaller chunks that load on-demand. Only load code needed for the current page.
CSS Optimization Techniques
- Minify CSS files: Similar to JavaScript, minification removes unnecessary characters.
- Tools: cssnano, clean-css, PurgeCSS
- Inline critical CSS: Extract and inline CSS required for above-the-fold content. This eliminates render-blocking external stylesheets for initial content.
- Tools: Critical, Penthouse, Critters
- Remove unused CSS: Typical websites use only 20-30% of loaded CSS. Removing unused styles dramatically reduces file size.
- Tools: PurgeCSS, UnCSS, Chrome DevTools Coverage tab
How to Enable Browser Caching and Compression
Caching and compression are configuration-based optimizations that require no code changes but deliver substantial speed improvements. Most websites see 40-60% load time reduction from proper caching and compression alone.
Browser Caching
Browser caching instructs browsers to store static resources (images, CSS, JavaScript) locally. On repeat visits, browsers load cached files instead of re-downloading them from your server.
How to Enable Caching:
For WordPress:
- Install WP Rocket ($49/year) or W3 Total Cache (free)
- Enable browser caching in plugin settings
- Set cache expiration: 1 year for static assets, 1 week for HTML
For Apache servers (.htaccess):
<IfModule mod_expires.c>
  ExpiresActive On
  ExpiresByType image/jpg "access plus 1 year"
  ExpiresByType image/jpeg "access plus 1 year"
  ExpiresByType image/gif "access plus 1 year"
  ExpiresByType image/png "access plus 1 year"
  ExpiresByType text/css "access plus 1 month"
  ExpiresByType application/javascript "access plus 1 month"
</IfModule>
For Nginx servers:
location ~* \.(jpg|jpeg|png|gif|ico|css|js)$ {
  expires 1y;
  add_header Cache-Control "public, immutable";
}
Gzip/Brotli Compression
Compression reduces file size before transmission. Gzip compression typically reduces HTML, CSS, and JavaScript files by 70-90%.
Compression Options:
- Gzip: Widely supported (99%+ browsers). Compression ratio: 70-80%
- Brotli: Modern alternative. 20-30% better compression than Gzip. Supported by 95%+ browsers.
How to Enable Compression:
WordPress:
- WP Rocket and W3 Total Cache automatically enable Gzip
Apache (.htaccess):
<IfModule mod_deflate.c>
  AddOutputFilterByType DEFLATE text/html text/css text/javascript application/javascript
</IfModule>
How to Use a Content Delivery Network (CDN)
A Content Delivery Network (CDN) is a geographically distributed network of servers that cache and deliver your website's static content from locations closest to your users. CDNs reduce latency by minimizing physical distance between servers and visitors.
How CDNs improve speed: When a user in Tokyo visits your US-hosted website, without a CDN they wait for data to travel 5,000+ miles. With a CDN, content serves from a Tokyo server, reducing load time from 2-3 seconds to 200-300 milliseconds.
CDN Providers and Setup
Cloudflare (Recommended for Beginners)
- Cost: Free tier includes CDN, DDoS protection, SSL
- Setup time: 15-30 minutes
- Performance: 200+ global data centers
- Best for: Small to medium websites, WordPress sites, startups
Setup Steps:
- Create free Cloudflare account at cloudflare.com
- Add your website domain
- Update nameservers at your domain registrar (provided by Cloudflare)
- Enable "Auto Minify" for HTML, CSS, JavaScript in Cloudflare dashboard
- Enable "Brotli" compression
- Set "Caching Level" to Standard
Alternative CDN Options:
- Amazon CloudFront: Enterprise-grade CDN. Integrates with AWS services. Pay-as-you-go pricing (~$0.085 per GB).
- Fastly: Real-time CDN with instant cache purging. Starts at $50/month. Best for high-traffic sites needing frequent updates.
- BunnyCDN: Budget-friendly option. $1 per TB. Good performance, simpler setup than AWS.
How to Optimize Server Response Time
Server response time (Time to First Byte - TTFB) measures how quickly your server responds to browser requests. Google recommends TTFB under 200ms. Slow server response delays everything else—even if your frontend is perfectly optimized.
Server Optimization Strategies
- Upgrade hosting plan: Shared hosting typically delivers 800-1500ms TTFB. Upgrading to VPS or dedicated hosting reduces TTFB to 200-400ms.
- Recommended hosts: DigitalOcean ($12/mo), Linode ($12/mo), Cloudways ($11/mo), Kinsta ($35/mo for WordPress)
- Enable server-side caching: Cache generated HTML pages instead of rebuilding them for each visitor.
- WordPress: Use WP Rocket or WP Super Cache
- Manual setup: Varnish Cache or Redis
- Optimize database queries: Slow database queries add 500-2000ms to page generation time.
- WordPress: Use Query Monitor plugin to identify slow queries
- Optimize: Add database indexes, clean up post revisions, remove unused plugins
- Use PHP 8.0+: Newer PHP versions are 2-3x faster than PHP 7.4 and older. Check with your host about upgrading.
How to Fix Mobile Performance Issues
Mobile performance is critical: 60%+ of web traffic comes from mobile devices, yet mobile connections are typically 3-5x slower than desktop broadband. Mobile users are also 5x more likely to abandon slow-loading sites.
Mobile-Specific Optimizations
- Serve mobile-optimized images: Detect mobile devices and serve appropriately sized images (max 800px width for mobile screens).
- Minimize third-party scripts on mobile: Each script is more expensive on mobile networks. Remove non-essential widgets, social media embeds, and analytics trackers on mobile.
- Reduce font file sizes: Web fonts add 100-500KB per font family. Use system fonts on mobile or limit custom fonts to 2-3 font files maximum.
- Implement AMP (Accelerated Mobile Pages): Google's mobile-optimized format. AMP pages typically load in under 1 second. Best for content sites and blogs.
- Test on real mobile devices: Simulators don't accurately reflect real mobile performance. Test on actual smartphones with 3G/4G connections.
What Common Speed Mistakes Should You Avoid?
- Using too many plugins/extensions: Each WordPress plugin adds code, database queries, and HTTP requests. Audit plugins quarterly and remove unused ones.
- Not compressing images before upload: Uploading 5MB photos directly from your camera is the #1 avoidable speed mistake. Always compress first.
- Hosting videos on your server: Self-hosted videos consume massive bandwidth and slow servers. Use YouTube, Vimeo, or Wistia instead.
- Using multiple font weights/styles: Each font weight (regular, bold, italic) requires a separate file. Limit to 2-3 weights maximum.
- Ignoring mobile performance: Optimizing only for desktop means ignoring 60%+ of your traffic. Test and optimize mobile separately.
- Not testing after plugin/theme updates: Updates can introduce performance regressions. Test speed after any major changes.
How to Create a Speed Optimization Action Plan
Speed optimization isn't a one-time project - it's an ongoing process. Use this framework to systematically improve and maintain website performance:
Phase 1: Baseline and Quick Wins (Week 1)
- Test current speed with Google PageSpeed Insights and GTmetrix
- Compress all images using TinyPNG
- Enable browser caching (via plugin or server config)
- Enable Gzip compression
- Remove obviously unused plugins/scripts
Expected improvement: 30-50% faster load time
Phase 2: CDN and Advanced Optimization (Week 2)
- Set up Cloudflare CDN
- Implement lazy loading for images
- Defer non-critical JavaScript
- Minify CSS and JavaScript
Expected improvement: Additional 20-30% improvement
Phase 3: Ongoing Monitoring (Monthly)
- Run monthly speed tests
- Review new plugins/scripts for performance impact
- Compress new images before upload
- Check Core Web Vitals in Google Search Console
What Tools Should Founders Use for Speed Optimization?
| Category | Free Tool | Premium Tool |
|---|---|---|
| Speed Testing | PageSpeed Insights, GTmetrix | Pingdom ($15/mo) |
| Image Compression | TinyPNG, Squoosh | ShortPixel ($4.99/mo) |
| CDN | Cloudflare Free | Cloudflare Pro ($20/mo) |
| Caching (WordPress) | W3 Total Cache | WP Rocket ($49/year) |
| Comprehensive Analysis | Talk to me Data (Free tier) | Talk to me Data Pro ($29/mo) |
Summary: Speed as a Competitive Advantage
Website speed isn't just a technical metric. It's a fundamental business driver that impacts conversion rates, revenue, SEO rankings, and user satisfaction. The data is clear: faster websites convert better, rank higher, and generate more revenue.
The encouraging news for founders: most speed improvements require no coding expertise. Image compression, caching, CDN setup, and browser optimization are all configuration-based changes achievable in hours or days, not weeks or months. The tools are largely free or low-cost, and the ROI is immediate and measurable.
Start with the highest-impact optimizations: compress images, enable caching, set up a CDN. These three changes alone typically reduce load time by 50-70%. Then monitor, test, and continuously optimize. Every 100ms improvement translates directly to increased conversions and revenue.
Related reading:
How to Increase Website Conversion Rate in 30 Days (No Redesign Required) →How to Analyze Your Website for Conversion Issues (Step-by-Step) →Want an AI agent doing your speed audits for you?
Book a free 20-minute call. We'll review your site's current performance, identify your highest-impact fix, and show you how an AI agent can keep your scores healthy — automatically.