
How to Analyze Your Website for Conversion Issues: A Complete Step-by-Step Guide
TL;DR - Key Takeaways
- Website conversion analysis is the systematic process of identifying barriers preventing visitors from completing desired actions
- Use the 7-step CONVERT framework: Analytics, Value Proposition, Speed, Mobile, Path Simplification, Trust Signals, and User Testing
- A 1-second delay in page load time reduces conversions by 7%; mobile users are 5x more likely to abandon slow sites
- Reducing form fields from 11 to 4 can increase conversions by 120%
- 86% of users won't convert on websites that lack trust signals
- Implement changes systematically and measure impact using A/B testing
What is Website Conversion Analysis?
Website conversion analysis is the systematic examination of your website to identify obstacles preventing visitors from completing desired actions (conversions) such as making purchases, signing up for services, or submitting contact forms. This process combines quantitative data from analytics tools with qualitative insights from user behavior studies to create a comprehensive picture of conversion barriers.
A conversion rate is calculated by dividing the number of conversions by total visitors and multiplying by 100. For example, if 1,000 people visit your site and 20 make a purchase, your conversion rate is 2%. Industry benchmarks vary significantly: e-commerce sites average 2-3%, SaaS platforms 3-5%, and lead generation sites 5-15%. Understanding these metrics provides the foundation for effective optimization. If you want to calculate your website's conversion rate, use our free Conversion Rate calculator.

Why Does Website Conversion Rate Matter for Business Growth?
Conversion rate optimization (CRO) directly impacts revenue without requiring increased traffic acquisition costs. Consider this: improving your conversion rate from 2% to 3% (a 50% relative increase) on a site with 10,000 monthly visitors means 100 additional conversions per month. At $100 average order value, that's $10,000 in additional monthly revenue or $120,000 annually.
Beyond revenue, conversion optimization provides three critical business benefits:
- Reduced customer acquisition cost (CAC): Better conversion rates mean you extract more value from existing traffic, lowering the cost per acquisition
- Improved user experience: Conversion optimization inherently creates a better, more intuitive website experience
- Competitive advantage: Most businesses neglect systematic conversion analysis, giving optimizers a significant edge
| Conversion Issue Type | Average Impact | Fix Difficulty |
|---|---|---|
| Slow page speed (>3s load) | -7% per second delay | Medium |
| Unclear value proposition | -20-40% conversion loss | Easy |
| Poor mobile optimization | -50-70% mobile conversions | Hard |
| Complex checkout/signup | -25-35% abandonment | Medium |
| Missing trust signals | -15-25% conversion loss | Easy |
The CONVERT Framework: A 7-Step Analysis Method
The CONVERT framework provides a systematic approach to website conversion analysis. Each step builds on the previous one, creating a comprehensive optimization strategy that addresses both technical and user experience issues.
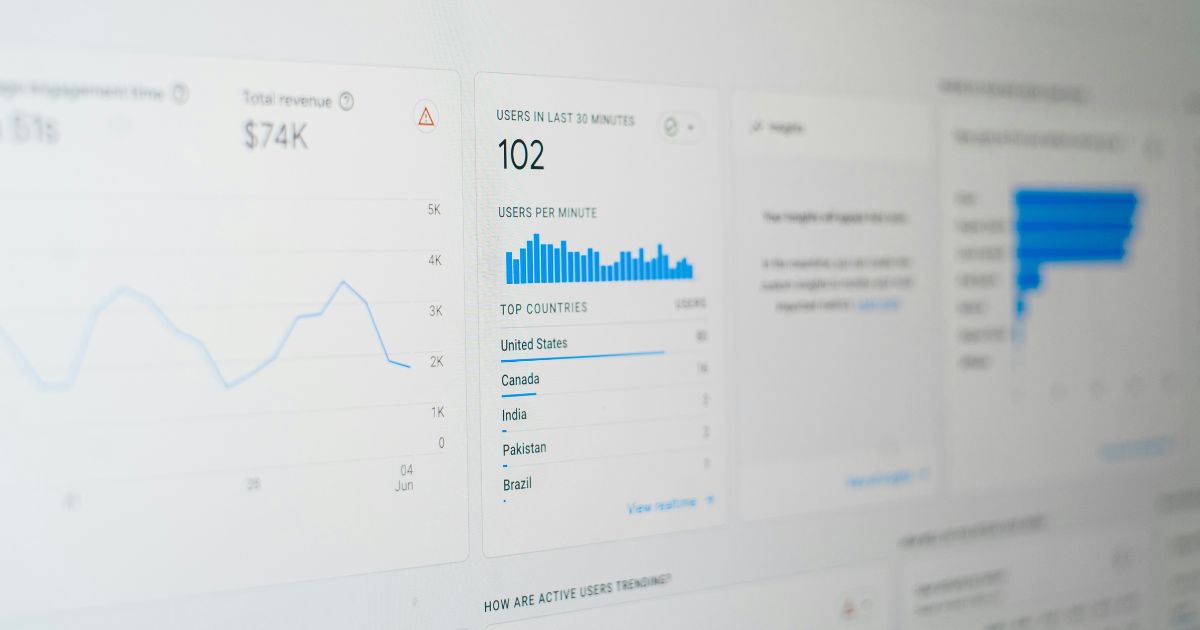
Step 1: How to Use Analytics Data to Identify Conversion Bottlenecks
Analytics data reveals where users struggle on your website. Start by examining four critical metrics in your analytics platform (Google Analytics, Mixpanel, or similar):
Essential Analytics Metrics
- Bounce rate by page: Identify pages with >70% bounce rates. These pages fail to engage visitors immediately. Check your top 10 landing pages and prioritize those with high traffic and high bounce rates.
- Conversion funnel drop-off: Map your conversion path (e.g., Homepage → Product Page → Cart → Checkout → Confirmation) and identify the step with the largest visitor drop-off. This pinpoints your biggest conversion barrier.
- Average session duration: Pages with <30 seconds average time indicate content-user mismatch or poor engagement. Compare this against your expected reading time.
- Device-specific conversion rates: Compare mobile vs desktop conversion rates. If mobile converts 50%+ lower than desktop, mobile optimization is critical.
Step 2: What Makes an Effective Value Proposition for Conversions
A value proposition is a clear statement that explains how your product solves customer problems, delivers benefits, and distinguishes you from competitors. Research shows visitors form first impressions in 50 milliseconds and decide whether to stay or leave within 5 seconds.
Your homepage must immediately answer three questions:
- What do you offer? (The product/service)
- Who is it for? (The target customer)
- What's the primary benefit? (The transformation or outcome)
❌ Ineffective Value Proposition:
"Revolutionizing digital transformation through innovative cloud-based synergistic solutions"
Why it fails: Vague, jargon-heavy, no specific benefit
✓ Effective Value Proposition:
"Get detailed SEO insights for your website in 60 seconds—no technical knowledge required"
Why it works: Specific outcome, clear timeframe, removes barrier
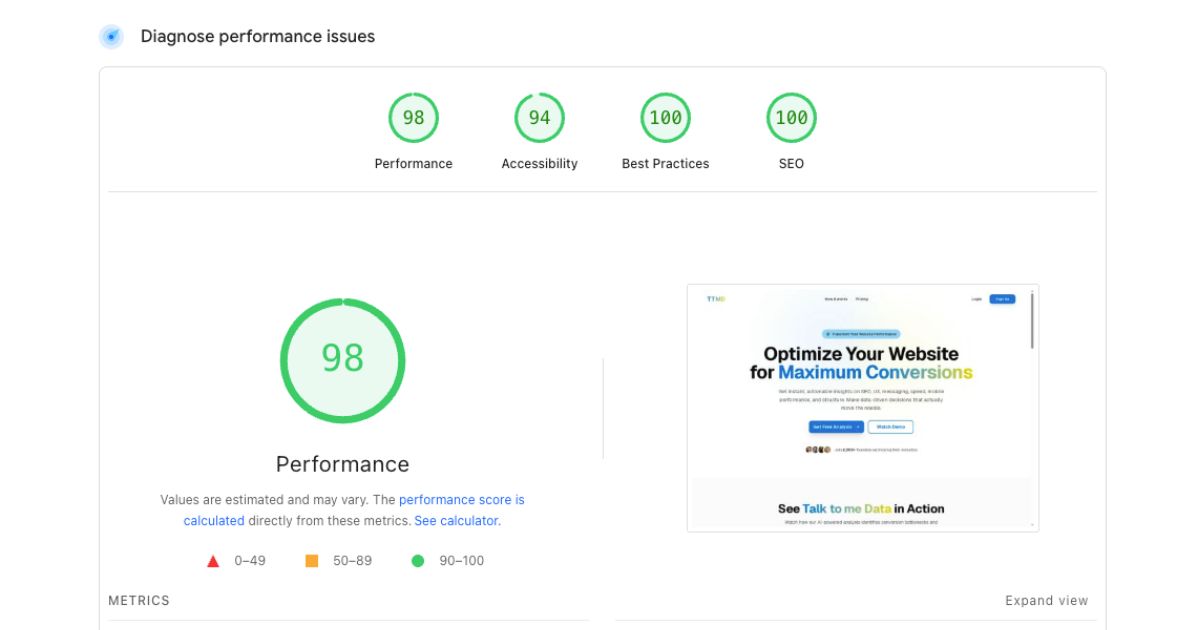
Step 3: How to Fix Website Speed Issues That Kill Conversions
Page speed directly correlates with conversion rates. Google research shows that as page load time increases from 1 to 3 seconds, bounce probability increases 32%. From 1 to 5 seconds, it increases 90%. Amazon found that every 100ms delay costs them 1% in sales.
Speed Testing Tools and Metrics
- Google PageSpeed Insights: Provides Core Web Vitals scores (LCP, FID, CLS) and specific optimization suggestions
- GTmetrix: Offers detailed waterfall charts showing exactly which resources slow your site
- WebPageTest: Tests from multiple global locations and device types
Quick Speed Optimization Wins
- Image optimization: Convert to WebP format (30-50% smaller than JPEG). Use responsive images with srcset. Lazy-load images below the fold.
- Enable compression: Activate Gzip or Brotli compression (reduces file sizes by 70-90%)
- Minimize render-blocking resources: Defer non-critical JavaScript and CSS. Inline critical CSS for above-the-fold content.
- Leverage browser caching: Set appropriate cache headers for static assets (images, CSS, JS)
- Use a CDN: Cloudflare, AWS CloudFront, or similar services distribute content geographically
Step 4: Why Mobile Optimization is Critical for Conversion Rates
Mobile devices generate over 60% of website traffic globally, yet mobile conversion rates average 1.53% compared to 3.90% on desktop. This gap represents enormous opportunity. Mobile users are 5x more likely to abandon tasks if a site isn't mobile-optimized.
Mobile Optimization Checklist
Touch Target Size
Minimum 44x44 pixels for buttons and links (Apple's Human Interface Guidelines). Provide 8px spacing between clickable elements.
Text Readability
16px minimum font size for body text. Line height of 1.5x font size. Avoid horizontal scrolling at any screen width.
Form Optimization
Use appropriate input types (tel, email, number) to trigger correct mobile keyboards. Implement autofill attributes. Minimize required fields.
Navigation Simplification
Use hamburger menus for complex navigation. Ensure primary CTA is visible without scrolling. Implement sticky headers on mobile.
Step 5: How to Simplify Your Conversion Path and Reduce Friction
Every additional step in your conversion funnel loses 20-30% of users. Expedia famously increased profits by $12 million by removing one form field. Reducing form fields from 11 to 4 increased conversions by 120% for one Hubspot study.
Friction Reduction Strategies
- Minimize form fields: Ask only for essential information. Use progressive profiling to collect additional data after initial conversion.
- Implement single sign-on: Allow Google/Apple/LinkedIn login to reduce signup friction.
- Show progress indicators: Multi-step forms should display progress (Step 2 of 3). This increases completion rates by 20%.
- Enable guest checkout: For e-commerce, allow purchases without account creation. You can offer account creation post-purchase.
- Reduce page transitions: Can you complete the conversion on one page instead of three? Each additional page load is an opportunity for abandonment.
Quick Win:
Audit your conversion path right now. Count the clicks from landing page to conversion completion. For each click over three, you're likely losing 25-30% of users. Prioritize eliminating unnecessary steps.
Step 6: What Trust Signals Increase Website Conversions
86% of consumers say website trust is a decisive factor in purchasing decisions. Trust signals are visual and textual elements that establish credibility and reduce purchase anxiety. They answer the visitor's unconscious question: "Can I trust this website with my money/information?"
| Trust Signal Type | Impact on Conversions | Implementation Priority |
|---|---|---|
| SSL Certificate (HTTPS) | +18% conversion rate | Critical |
| Customer testimonials with photos | +34% conversion rate | Critical |
| Money-back guarantee | +25% conversion rate | High |
| Security badges (Norton, McAfee) | +15% conversion rate | High |
| Client logos (B2B) | +20% conversion rate | High |
| Contact information visible | +12% conversion rate | Medium |
Step 7: How to Conduct User Testing for Conversion Insights
Analytics reveal what users do; user testing reveals why they do it. User testing involves observing real users as they attempt to complete tasks on your website, identifying confusion points, and understanding their decision-making process.
Simple User Testing Protocol
- Recruit 5-7 participants: Target users who match your customer profile. Even 5 users reveal 85% of usability issues.
- Define specific tasks: Example: "Find and purchase a blue t-shirt in size medium." Tasks should align with your conversion goals.
- Observe without helping: Watch users navigate. Note where they hesitate, what they click, what they say aloud. Don't guide them or answer questions.
- Ask follow-up questions: "What did you expect to happen?" "What confused you?" "What would make this easier?"
- Document patterns: Look for issues multiple users encounter. Single-user problems might be outliers; 3+ users experiencing the same issue indicates a systemic problem.
Budget-Friendly Testing Options:
- UserTesting.com: $49 per test for recorded sessions with real users
- Posthog: Free heatmaps and session recordings to see user behavior
- Talk to Me Data: Free website reports that help identify conversion issues
- Friends and family: Free, though less representative of your target market
- Social media recruitment: Post in relevant groups offering small incentives
How to Implement and Test Conversion Improvements
After identifying issues, implement changes systematically using A/B testing to validate impact. A/B testing compares two versions (A and B) to determine which performs better, eliminating guesswork from optimization.
A/B Testing Best Practices
- Test one change at a time to isolate impact
- Achieve statistical significance before declaring a winner (typically 95% confidence level)
- Run tests for at least one full business cycle (usually 1-2 weeks minimum)
- Prioritize high-traffic pages for faster results
- Document all tests and results for future reference
The shortcut
Analysis tells you where visitors drop off. An AI agent stops the drop-off from happening in the first place.
The CONVERT framework helps you identify what's broken. But for the most common conversion killers — hesitation, unanswered questions, trust gaps — there's a faster fix: an AI agent that handles those moments live, while the visitor is still on your page.
- ✓Addresses the drop-off your funnel analysis reveals — when analytics show visitors leaving at the pricing section, the agent answers pricing questions in real time before they bounce
- ✓Delivers your trust signals at the right moment — surfaces testimonials, guarantees, and social proof exactly when a visitor's behaviour signals they need reassurance
- ✓Simplifies the conversion path on the spot — instead of sending visitors through a form, the agent qualifies them conversationally and books a call directly
- ✓Captures the leads your analysis says you're losing — exit-intent engagement that recovers prospects before they disappear from your funnel for good
We build, deploy, and host the agent. You keep running your analysis — and start seeing results faster.
What Tools Do You Need for Conversion Analysis?
| Tool Category | Recommended Tools | Cost |
|---|---|---|
| Assessment | Talk to Me Data | Free - $39/mo |
| Analytics | Google Analytics 4, Mixpanel | Free - $89/mo |
| Speed Testing | PageSpeed Insights, GTmetrix | Free |
| Heatmaps | Posthog, Hotjar, Microsoft Clarity | Free - $39/mo |
| A/B Testing | Google Optimize, VWO | Free - $199/mo |
| User Testing | UserTesting, Lookback | $49 per test |
Summary: Converting Analysis into Revenue
Website conversion analysis isn't about making random changes and hoping for improvement. It's a systematic, data-driven process that identifies specific barriers preventing conversions and implements targeted solutions.
The CONVERT framework - Analytics, Value Proposition, Speed, Mobile, Path Simplification, Trust Signals, and User Testing - provides a comprehensive methodology for identifying and fixing conversion issues. Start with high-impact, low-effort changes (unclear value propositions, missing trust signals) before tackling complex technical implementations.
Remember: A 1% improvement in conversion rate translates to thousands of dollars in additional revenue. The time invested in systematic analysis compounds over time, creating sustainable competitive advantage.
Want to know exactly what's costing you conversions?
Book a free call and we'll walk through your site using the CONVERT framework — and show you how an AI agent can fix the biggest drop-off points automatically.